Arkori Qingqing
Jiangsu Ankerui Electric Appliance Manufacturing Co., Ltd. Jiangyin , Jiangsu 214405
Abstract: The Ankerui power monitoring system was introduced . The smart power meters were used to collect various electrical parameters of 48 multi-function network power meters distributed in substations . The system adopts the on-site local networking method. After the networking, it is transmitted remotely to the monitoring background through fieldbus communication. The power monitoring system is used to realize the real-time monitoring and management of power distribution circuit substations .
Keywords: substation; multifunctional network power meter; power monitoring system ;
0 Overview Â
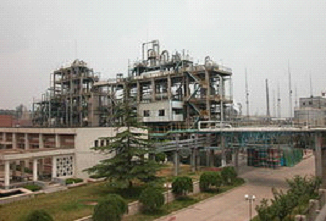
Shandong Qilu Plasticizers Co., Ltd. is located in Zibo City, Shandong Province, and was founded in 1989. It has a total assets of 800 million yuan, a production capacity of 400,000 tons of plasticizer per year, and a phthalic anhydride of 70,000 tons per year. The main products are phthalic anhydride, 810 ester, DOP, DBP, DIBP, DIDP, DINP and other varieties.
Acrel Electric Co., Ltd. in June 2013 to undertake the design and implementation of new office Shandong Qilu distribution chamber plasticizer Co. power monitoring system, the power distribution system has two-way power line 0.4 kV, 2 Reactive power compensation, 44- channel 0.4 kV power outlets.
1 customer needs
Field instrument 48 of the voltage loop in the same distribution substations, power monitoring system required to achieve centralized management of data, analysis and processing. The software probably functions as follows:
1. Centrally collect 48 loops of low-voltage meter data and display it in a system diagram interface.
2. When the current of each loop exceeds the limit , the system informs the management personnel through the sound and light alarm to eliminate the potential safety hazard.
3. It is necessary to analyze the trend of electricity consumption of various loops in real time and historically, so as to facilitate the peak shifting and valley filling, and the peak load power supply and production .
4, can check the specific electricity consumption of a certain circuit or several circuits every day, and can be compared through the report .
According to user needs, the need for networking and establishing the fieldbus power monitoring system (mainly real-time monitoring of data), set up monitoring platform in the control center duty room, real-time monitoring of 48 loops, statistics on the scene change with the electricity through analysis To ensure the safety, reliability and efficiency of electricity use.
2 System Structure Description
The system adopts a hierarchical distributed structure for design, namely station management layer, network communication layer and field device layer. The network diagram of the project team is as follows. 48 multi-function network power meters on the site are connected to the serial port via RS485 field bus. The server is then transmitted to the on-site monitoring host via Ethernet to achieve data collection, storage, processing, display and upload as shown in Figure (1):
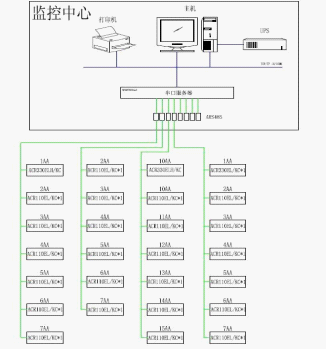
Figure (1) Network topology of power monitoring system
Interval equipment layer mainly includes: Multi-functional network power meters, corresponding to the corresponding primary equipment distributed and installed in the electrical cabinet of the same power distribution room . These devices all adopt RS485 communication interface, and realize on-site data collection through field MODBUS bus network communication. .
The main network communication layer is: a communication server. The main function of the communication server is to collect the scattered data at the site collection device, and transmit it to the station control layer at the same time, to complete the data exchange between the field layer and the station control layer.
Station control management: equipped with high-performance industrial computers, monitors, UPS power supplies, printers and other equipment. The monitoring system is installed on the computer to collect and display the operating status of the field equipment and display it to the user in the form of human-computer interaction.
After the completion of the construction of multi-function power meter are used RS485 interface and communication protocol MODBUS-RTU, RS485 shielded transmission line, generally using two wires, wiring is simple and convenient; both half-duplex communication is a communication interface that is in communication You may receive and send data at the same time but can only send or receive data, the maximum data transfer rate of 10Mbps.
RS48 5 interface is a balanced differential driver and receiver combination, enhanced noise immunity, allows up to 32 devices on the bus, the maximum transmission distance of 1.2km.
3 main functions of power monitoring system
3.1 Data Acquisition and Processing
Data acquisition is the basis of power monitoring . Data acquisition is mainly completed by the underlying multi-function network instrumentation to achieve local real-time display of remote data. The signals that need to be collected include: three-phase voltage U, three-phase current I, frequency Hz, power P, power factor COSφ, power Epi, and remote device operating status.
Data processing mainly displays the electrical parameters collected according to requirements in real time and accurately to the user, achieving the automation and intelligence requirements of the power monitoring , and storing the collected data in the database for user query.
3.2 historical events
The main historical event viewer interface for users to view the fault record have occurred, signal recording, the recording operation, the limit recording to facilitate a friendly interactive view platform by historical events, you can easily locate according to their requirements and search criteria The historical events that you want to view provide good software support for you to grasp the operation of the entire system.
3. 3 database establishment and inquiry
It mainly completes remote measurement and remote signal acquisition, and establishes a database to generate reports regularly for users to query and print.
3. 4 operating load curve
Load trend curve function is mainly responsible for the timing of important loop current and power load parameters, automatic generation of operating load trend curve, to facilitate users to understand the equipment operating load status. Click the corresponding button or menu item of the screen to complete the switching of the corresponding function; you can view the real-time trend curve or historical trend line; the selected curve can be translated, zoomed, range conversion and other operations to help the user to enter the line trend analysis and fault recall . Analyzing the entire system's operating status provides intuitive and convenient software support .
3.5 Remote Query Report
The main function of the report management program is to design the report style according to the needs of the user, and the data processed in the system is filtered, combined and statistically generated to generate the report data required by the user. This program can also be based on the needs of users of the report file to save, print or summon save, print mode. At the same time, this program also provides users with management functions for generated report files.
The report has the functions of freely setting the query time to realize daily, monthly, and annual energy statistics, data export, and report printing.
4 Case Studies
The monitoring system mainly realizes the real-time monitoring, analysis and management of the 48 circuit substations of Jinhan Energy Saving and Thermal Insulation Technology Co., Ltd. The monitoring scope is shown in Table 1 below :
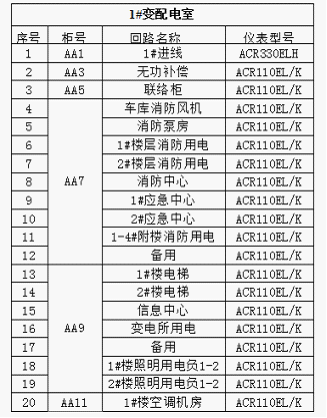
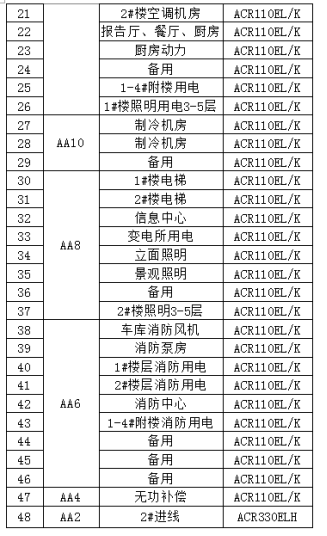
Table 1 Distribution of monitoring points
According to its modified circuit, the system can display primary circuit operation status in real time. The function has the power telemetering to mainly monitor the electrical parameters of the operation equipment, including: line three-phase voltage, current, power, power factor, electrical energy, frequency and other electrical parameters. See Figure (2) , ( 3 )
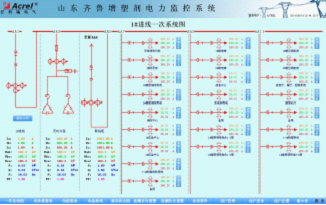
Figure ( 2 ) 1# line into a system diagram

Figure ( 3 ) 2# line into a system diagram
The system monitors the communication status of all points on the site. The red and green colors indicate that the instrument communication is abnormal and normal. It is convenient for users to check the communication status of each monitoring point , as shown in ( 4 ) :

Figure ( 4 ) Communication State Diagram
The telemetry alarm function is mainly used to indicate the specific alarm position and audible alarm for the straightforward change and main change load over-limit pop-up alarm interface to remind the on-duty personnel to deal with it in time. The load limit can be set freely under the corresponding authority. With historical query function, see Figure ( 5 ).
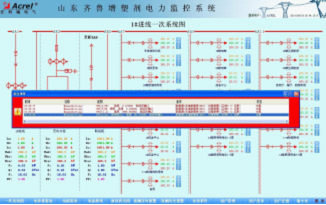
Figure ( 5 ) Limit Alarm Information
The electricity consumption report function can select the time period to inquire, supports the accumulated electricity inquiry at any time , and has the functions of data export and report printing. Provide accurate and reliable power report for duty personnel. Circuit name and database associated with the respective report, user name circuit modification, the user can directly print the report, and exported to EXCEL format as shown in Figure (6):

Figure ( 6 ) Energy Report
Parameter meter reading function, all the main electrical parameters into the line loop query. Supports electrical parameter query at any time, with functions such as data export and report printing. The electrical parameters mainly include: three-phase voltage, three-phase current, active power, reactive power, frequency, and active power . As shown in Figure ( 6 ).

Figure ( 7 ) Parameter reading
The load trend curve interface allows you to visually check the load operation of the loop. View real-time and historical trend curves, click the corresponding button or menu item to complete the switching of corresponding functions; help the user to enter the trend analysis and fault recall, with curve printing function. Provides intuitive and convenient software support for analyzing the operating status of the entire system , see ( 8 ).

Figure ( 8 ) Current trend curve
4 Conclusion
1) The system in August 2013 to complete the on-site commissioning, passed user acceptance and put into operation, the system is stable and reliable, has not any fault occurs, praised by users.
2) The successful implementation of this project shows that: The project's technical plan is scientific, reasonable and feasible.
3) The system adopts centralized monitoring of distributed power distribution and achieves the expected results. The interface of power monitoring software meets the needs of users and effectively reduces design and construction costs.

Cardboard Magnetic Palette,Cardboard Empty Palette,Custom Makeup Palette,Concealer Packaging
Sunchina Packing Limited , https://www.dgsunchina.com